Volatility is a critical factor in cryptocurrency options trading, influencing pricing, risk, and strategy decisions. Traders rely on two key metrics:
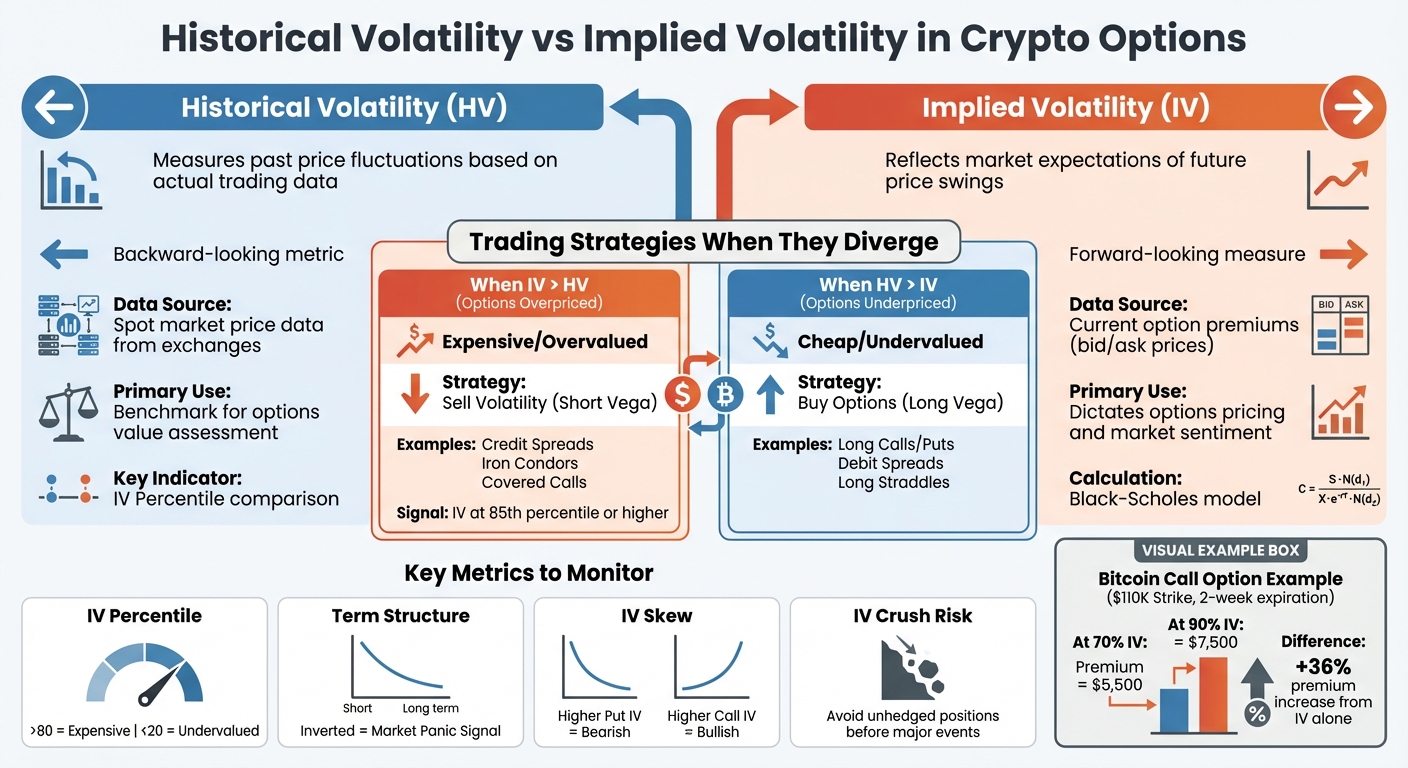
- Historical Volatility (HV): Measures past price fluctuations based on actual trading data, helping assess risks and benchmark options pricing.
- Implied Volatility (IV): Reflects market expectations of future price swings, derived from current option premiums. IV often dictates options pricing and market sentiment.
Key takeaways:
- When IV exceeds HV, options are often overpriced, favoring strategies like selling volatility through spreads or condors.
- When HV surpasses IV, options may be undervalued, making buying strategies like long calls or straddles more attractive.
- Events like CPI reports or market stress can cause rapid IV changes, requiring traders to adjust strategies to manage risks effectively.
Understanding the interplay between HV and IV enables traders to navigate crypto options markets more effectively, avoid overpaying for premiums, and capitalize on market conditions.
Historical vs Implied Volatility in Crypto Options Trading
1. Historical Volatility
Definition
Historical volatility, sometimes referred to as realized volatility, measures how much the price of a cryptocurrency has fluctuated over a specific past timeframe. It’s a backward-looking metric that uses actual spot market data to capture the extent and consistency of price changes.
Data Source
To calculate historical volatility, traders rely on price data from the spot market. This involves analyzing historical trading prices recorded by exchanges for assets like Bitcoin or Ethereum. Unlike implied volatility, which is derived from option premiums using models such as Black-Scholes, historical volatility is solely based on real trading activity.
Primary Use in Crypto Trading
Traders use historical volatility as a benchmark to assess the value of options. One popular method is calculating the "IV Percentile", which compares current implied volatility against historical levels. For instance, if Solana’s implied volatility (IV) is in the 85th percentile, it indicates that current volatility is higher than 85% of past readings. This often signals elevated options premiums, potentially favoring strategies like iron condors or credit spreads.
When realized volatility surpasses implied volatility, traders holding gamma positions can see significant gains. This happens because actual price movements exceed what the market had anticipated. A notable example occurred in February 2026, as documented by Imran Lakha of Options Insight Research. During a period of extreme market stress, Bitcoin’s realized volatility surged past 80, while Ethereum’s exceeded 100, reflecting intense sell-offs. Despite increases in implied volatility, the realized price swings were even greater, creating profitable conditions for gamma positions.
"Realized volatility has surged aggressively – BTC moving above 80 and ETH exceeding 100. These are stress-level prints, reflecting both the magnitude and persistence of the sell-off." – Imran Lakha, Author, Options Insight Research
Historical volatility also plays a key role in identifying risks related to implied volatility crush. For example, before major events like a CPI report or protocol upgrade, implied volatility often spikes well above historical averages. If it collapses after the event, traders who purchased expensive options may face losses, even if the underlying asset moves. By comparing current implied volatility to historical norms, traders can avoid overpaying for options premiums tied to event-driven volatility.
With this understanding of historical volatility, we can now explore implied volatility and its impact on pricing in crypto options markets.
sbb-itb-7e716c2
2. Implied Volatility
Definition
Implied volatility (IV) gives traders a way to predict future price swings, unlike historical volatility, which only looks at past movements. It reflects the market’s expectations for how much an asset’s price might change before an option expires. This forward-looking measure is derived from current option prices.
"Implied volatility is a forward-looking measure of the expected volatility of an asset over a specified time period, derived from the market price of the option contract." – Kaiko
Data Source
IV is calculated using live option prices, specifically the bid and ask premiums, from exchanges like Deribit and PowerDEX. However, crypto markets often deal with challenges like low trading volumes, sparse quotes, and wide bid-ask spreads. To address these issues, data providers such as Kaiko use interpolation techniques and frequent updates to create more reliable IV metrics.
Calculation Method
The Black-Scholes model is a commonly used tool for calculating IV. It factors in known variables like the asset’s current price, strike price, time until expiration, and the risk-free interest rate. Due to the unique volatility and inefficiencies in crypto markets, some traders also turn to alternative methods like binomial trees or Monte Carlo simulations for better accuracy.
Primary Use in Crypto Trading
Implied volatility plays a critical role in crypto trading for several reasons:
- Pricing Options: IV helps traders assess whether option premiums are overpriced or underpriced compared to historical trends. For example, a Bitcoin call option with a $110,000 strike price might see its premium increase from $5,500 to $7,500 just because IV rose from 70% to 90%, even if Bitcoin’s price doesn’t change.
- Risk Assessment: IV is a useful gauge of market risk. When short-term IV surpasses long-term IV (an inverted term structure), it often signals market panic. For instance, on August 4, 2024, Kaiko data showed Bitcoin’s IV term structure inverted one day before BTC dropped below $50,000.
- Market Sentiment: Traders analyze IV skew – the difference in IV between calls and puts – to understand sentiment. Higher IV for puts often signals bearish positioning, while higher IV for calls indicates optimism about price increases.
| Market Condition | IV Trend | Recommended Strategy |
|---|---|---|
| Pre-Event Uncertainty | Expansion (Rising IV) | Long Straddle / Long Strangle |
| Post-Event Resolution | IV Crush (Falling IV) | Short Options / Iron Condor |
| Bullish Sentiment | Right Skew (Call IV > Put IV) | Bull Spreads / Long Calls |
| Market Panic | Inverted Term Structure | De-risk / Reduce Exposure |
One common trap is the "IV crush", where implied volatility drops sharply after major events like CPI reports or network upgrades. Even if the price moves as expected, traders who bought options during high IV may see premiums plummet, wiping out potential gains. To avoid overpaying, traders can compare current IV to its historical percentile. For example, when IV reaches the 85th percentile or higher, options are generally expensive, making strategies that involve selling volatility more appealing.
Understanding these key aspects of implied volatility lays a strong foundation for exploring how it directly influences crypto options pricing in the next section.
Educational Series – Crypto Realized & Implied Vol
How Volatility Affects Crypto Options Pricing
Let’s dive deeper into how historical volatility (HV) and implied volatility (IV) influence crypto options pricing. While HV reflects past price fluctuations, IV captures the market’s expectations for future volatility. These two metrics work together to shape how options are priced, with IV often playing a more dominant role.
In fact, the Black-Scholes model relies heavily on IV to calculate option prices. For instance, imagine a Bitcoin call option with a $110,000 strike price and a two-week expiration. If IV is at 70%, the option might be priced at $5,500. But if IV spikes to 90% – perhaps due to an upcoming Consumer Price Index (CPI) announcement – the premium could soar to $7,500. This demonstrates how sensitive options pricing is to changes in IV, making it a critical factor for traders.
However, crypto markets bring their own set of challenges. Low trading volumes, sparse quotes, and wide bid-ask spreads make it tricky to determine precise IV levels. For example, Bitcoin often sees its IV climb from 55% to 80% ahead of U.S. CPI reports. Altcoins, like Solana, can experience even more dramatic swings, with IV hitting 120% during meme coin rallies – levels far beyond what’s typically seen in equity markets. Due to these complexities, traders often turn to alternative pricing methods like binomial trees or Monte Carlo simulations.
"When IV rises, both puts and calls become more expensive – even if the underlying price hasn’t moved." – PowerTrade/Polaris
Another key concept to understand is the "IV crush." After major events, such as network upgrades or ETF approvals, IV can drop sharply, wiping out premium value even if the underlying price moves as expected. This makes timing and volatility analysis crucial for crypto options traders.
To avoid overpaying for premiums, compare the current IV to its historical percentile. If IV hits the 85th percentile or higher, options tend to be expensive, which might make selling volatility a better strategy than buying it. Additionally, strategies like vertical or calendar spreads can help reduce the cost impact of high IV, especially when heading into events likely to shake up the market. These tools and insights are essential for managing the risks that come with volatility in crypto options trading.
Trading Strategies When Historical and Implied Volatility Diverge
When historical volatility (HV) and implied volatility (IV) diverge, it opens up opportunities to adjust trading strategies based on pricing discrepancies.
When IV Exceeds HV
If IV is higher than HV, it means options are priced higher because the market expects larger price swings than recent historical data suggests. In this case, options are considered expensive, making it a good time to sell volatility. Strategies like credit spreads, covered calls, and iron condors are ideal because they allow traders to collect inflated premiums while anticipating minimal price movement.
For example, selling a Bitcoin bear call spread ahead of a Federal Reserve meeting – when IV is at the 85th percentile – lets you take advantage of high premiums with limited risk.
"When implied volatility is significantly higher than the average historical levels, options premiums are assumed to be overvalued. Higher-than-average premiums shift the advantage to options writers."
When HV Exceeds IV
On the flip side, if HV is higher than IV, options are priced lower than they should be based on past price movements. This creates opportunities to buy undervalued options. In this scenario, strategies such as long calls, long puts, debit spreads, and straddles become attractive. You can gain exposure to potential price swings without overpaying for the options.
For instance, purchasing Ethereum puts during a quiet market – when historical data suggests the potential for sudden breakouts – can help capitalize on undervalued premiums.
Key Scenarios and Strategies
| Scenario | Pricing Status | Preferred Stance | Example Strategies | Primary Risk |
|---|---|---|---|---|
| IV > HV | Expensive/Overvalued | Option Seller (Short Vega) | Credit Spreads, Iron Condors, Covered Calls | A massive breakout beyond the short strike |
| HV > IV | Cheap/Undervalued | Option Buyer (Long Vega) | Long Calls/Puts, Debit Spreads, Long Straddles | Time decay if the price remains flat |
Managing Position Sizing and Volatility Risks
Once you’ve identified the right strategy, managing position size becomes critical to handle extreme market moves. For example, in early 2026, Bitcoin’s realized volatility surged above 80, and Ethereum’s surpassed 100. In such conditions, reducing position sizes helps mitigate the heightened risk of significant price swings. As Imran Lakha, Founder of Options Insight, advises:
"Reduce position sizes in periods where short-term volatility triples historical norms."
Finally, keep an eye on inverted term structures – when short-dated options have higher IV than long-dated ones. This often signals market panic and can present opportunities for calendar spreads as volatility normalizes.
How to Use Volatility Metrics in Your Trading
To effectively incorporate volatility metrics into your trading strategy, it’s essential to focus on a few key indicators and understand how they influence market dynamics.
Start by tracking IV Percentile. This metric helps determine whether options are overpriced or underpriced compared to historical levels. For example, when the IV percentile exceeds 80, it suggests options are expensive, favoring strategies like selling volatility. On the other hand, if the IV percentile drops below 20, options become undervalued, making strategies like straddles or strangles more attractive.
Another crucial factor is the term structure of implied volatility across different expiration dates. Typically, longer-dated options carry higher IV due to the added uncertainty over time. However, an inverted term structure – where short-term IV surpasses long-term IV – signals heightened market panic. A notable instance occurred during the August 2024 crash when Bitcoin’s term structure inverted on August 4, just one day before prices fell below $50,000. Understanding these shifts can directly impact how you price and position your options.
Pay attention to IV skew, which compares implied volatility across various strike prices. If puts are trading at higher IV than calls, it reflects increased demand for bearish protection and hedging. Conversely, higher IV in calls often signals bullish speculation. This analysis can uncover potential opportunities. For example, if Bitcoin put IV is significantly elevated, it might indicate a chance to purchase cheaper calls in anticipation of a market reversal. Additionally, be prepared to manage rapid IV changes, known as IV crush, by adjusting your strategies proactively.
To avoid IV crush, steer clear of unhedged option positions ahead of major events like Federal Reserve announcements or network upgrades. These events often cause IV to spike by 20–30%, only to collapse afterward. A practical approach in such scenarios is using calendar spreads – selling near-term options while buying longer-term ones – to capture the differential IV decay across expirations during periods of heightened volatility.
For advanced tools and resources, platforms like BeyondOTC connect traders with OTC desks and liquidity providers. These services offer tailored solutions for managing volatility across major assets and altcoin markets. They also provide access to specialized structures and tools for precise IV calculations, which can be invaluable in markets with low trading volumes and wide bid-ask spreads, where accurate pricing becomes more challenging.
Conclusion
HV reflects historical market behavior, while IV provides a glimpse into future expectations. Together, these metrics give traders a comprehensive view to identify mispriced options and uncover trading opportunities before they become widely apparent.
Understanding pricing dynamics is essential for refining trading strategies. For example, if IV is at the 85th percentile but HV remains moderate, options are likely overpriced – this scenario often favors strategies like selling volatility through spreads. On the other hand, when IV is relatively low, options may be more appealing for buyers. Pay close attention to term structure inversions, where short-term IV surpasses long-term IV. These inversions often hint at potential market stress, as observed during previous downturns.
"IV can play a crucial role in determining and managing risk in the options market, as well as measuring sentiment." – Adam Morgan McCarthy, Research Analyst, Kaiko
IV skew is another valuable tool for assessing market sentiment across strike prices. For instance, when puts trade at higher IV than calls, it indicates the market is pricing in bearish protection. By synthesizing these volatility metrics, you can tailor your strategies – whether selling high IV or buying undervalued options – to fit the current market conditions. Be cautious about buying options right before major events like CPI reports or network upgrades, as IV often collapses afterward, reducing premium value even if the direction is correct.
For larger trades or access to specialized tools, BeyondOTC connects traders with OTC desks and liquidity providers, offering enhanced flexibility and liquidity for managing volatility-driven strategies.
FAQs
How do I calculate IV percentile for a crypto option?
To figure out the implied volatility (IV) percentile for a crypto option, you need to compare the current IV against its historical range over a given time frame. The formula looks like this:
IV Percentile = [(Current IV – Min IV) / (Max IV – Min IV)] × 100%
This calculation helps you see where the current IV stands within its historical range – 0% represents the lowest point, while 100% marks the highest.
What’s the best way to avoid an IV crush around big events?
When major events are on the horizon, implied volatility (IV) can drop sharply, causing options premiums to plummet – a phenomenon known as an IV crush. To navigate this, you can use strategies that minimize exposure to these sudden declines.
One approach is selling options before the event, allowing you to take advantage of premium decay. Alternatively, spread strategies like straddles or strangles can balance out potential losses by combining different positions. Another option is to focus on longer-dated options, which are generally less impacted by swift IV drops. These methods can help you manage the risks associated with an IV crush more effectively.
How do IV term structure and skew affect my strategy choice?
The implied volatility (IV) term structure and skew play a crucial role in crafting options strategies. When the IV term structure is steep, it signals higher premiums for longer-dated options. This setup often works well for strategies like calendar spreads. On the other hand, a flat or inverted term structure points to lower anticipated future volatility, making outright calls or puts more appealing.
Skew, on the other hand, reveals market sentiment. A bearish skew tends to favor protective put strategies, while a bullish skew aligns with strategies designed to capitalize on potential upside, matching the market’s outlook.