Tracking the right KPIs is essential for a successful launchpad investor outreach campaign. Without clear metrics, it’s easy to mistake activity for progress. Here are the five key KPIs you need to monitor:
- Retail Investor Sign-Up Rate: Measures how effectively your messaging converts visitors into sign-ups. A high rate shows you’re reaching the right audience.
- Engagement Rate: Tracks how investors interact with your materials (e.g., email opens, clicks). Strong engagement signals genuine interest.
- Conversion Rate to Commitments: Determines how many engaged investors commit funds. Warm leads convert much better than cold outreach.
- Total Committed Funds: The actual capital secured – tracked in both USD and tokens – indicates your campaign’s financial success.
- Investor Retention and Referral Rate: Measures how many investors return for future rounds and bring in new participants, highlighting long-term community growth.
Each KPI provides actionable insights to refine your outreach, boost engagement, and secure funding. By leveraging these metrics, you can identify weak points in your pipeline and improve overall results.
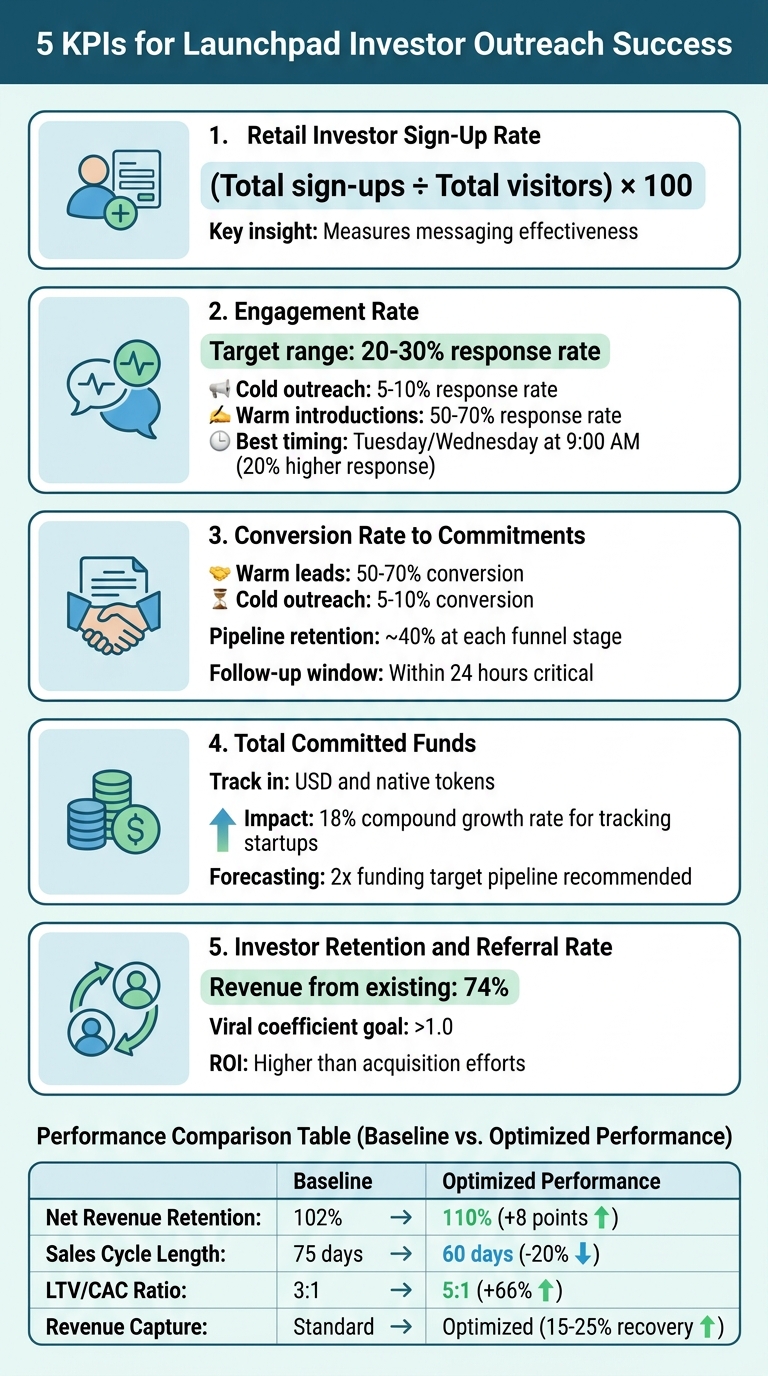
5 Essential KPIs for Launchpad Investor Outreach Success
1. Retail Investor Sign-Up Rate
The retail investor sign-up rate tracks the percentage of visitors who register for your launchpad opportunity. It’s a key indicator of whether your messaging resonates with the right audience.
Sign-up velocity, or the speed at which registrations happen, adds another layer of insight. As Sagar Agrawal from Qubit Capital puts it:
"Signup velocity can also validate whether your messaging and value proposition are landing".
For example, a sudden surge in registrations after launching a campaign suggests your messaging hit the mark. On the other hand, a slow trickle might mean your targeting or messaging needs a closer look. This metric also helps assess how well you’re reaching the ideal investor profile.
A high sign-up rate suggests you’re effectively targeting investors by market focus, investment stage, or geographic location. But if website visitors aren’t converting into sign-ups, there’s likely a disconnect between your audience and your offering. To measure this, use the formula:
(Total sign-ups ÷ Total visitors) × 100.
Trust plays a big role in encouraging registrations. Retail investors often look for clear token distribution plans, strong security measures, and regulatory compliance before committing. Offering a teaser deck or a summary can also encourage sign-ups. Beyond just numbers, it’s important to track deeper engagement signals like waitlist shares, email replies, or repeat visits to your landing page. These behaviors indicate genuine interest rather than casual curiosity.
To ensure consistent tracking, centralize your sign-up data – whether that’s through a CRM or even a basic spreadsheet. Define what qualifies as a "high-potential" sign-up early on. This way, your team can focus on serious retail investors rather than chasing vanity metrics that don’t lead to meaningful commitments.
2. Engagement Rate
After analyzing the sign-up rate, engagement metrics provide a clearer picture of investor interest and behavior. Engagement rate looks at how retail investors interact with campaign materials – like opening emails, clicking on pitch decks, or responding directly – beyond just signing up. Let’s break down the specifics of timing and behavior that signal genuine investor interest.
For response rates, aim for the sweet spot: 20% to 30%. If your rate drops below 15%, it could mean your targeting needs improvement. Cold outreach typically sees response rates between 5% and 10%, whereas warm introductions can skyrocket to 50% to 70%.
Timing plays a huge role in engagement. Emails sent at 9:00 AM have a 20% higher response rate, and outreach on Tuesday or Wednesday mornings tends to perform best. Pay attention to your average response time, too. If investors take more than seven days to reply, your message might not be hitting the mark.
"Use email engagement data to uncover who the investors are who are most interested and engaged with your company." – Visible.vc
Click-through rates on materials like teaser decks or financial models are another key indicator. These rates show how seriously investors are digging into your company. High click-through rates could mean it’s time for immediate follow-up, while low or no activity within 14 days suggests it’s time to either nurture the lead or move on.
Personalization can take your engagement to the next level. Tailor messages by mentioning specific aspects of an investor’s portfolio or referencing a recent post they made. Including a clear traction metric – like revenue growth or user numbers – can also boost response rates significantly.
3. Conversion Rate to Commitments
After tracking sign-ups and engagement, the next step is understanding how many of those engaged investors actually commit funds. This is where the conversion rate to commitments comes in – it measures the percentage of engaged investors who take the leap and invest. While sign-ups and engagement reflect interest, this metric reveals whether your campaign is turning interest into action.
Fundraising works a lot like a sales funnel. At each stage, you typically retain around 40% of the volume from the previous one. A strong conversion rate shows that your pitch is hitting the mark. On the other hand, a low rate can point to issues with your targeting, the quality of your materials, or even how you’re following up. Think of this KPI as the final checkpoint to gauge your campaign’s effectiveness before diving deeper into the fundraising journey.
"The company that manages investor pipeline best wins, not the best storyteller." – Lech Kaniuk
One critical factor is the difference between warm and cold outreach. Warm introductions convert at a rate of 50% to 70%, while cold emails only manage 5% to 10%. This highlights where your time is best spent – cultivating warm leads. Timing also matters. Following up within 24 hours is crucial to keep the momentum going. Wait longer than 14 days, and your chances of closing the deal drop significantly.
Fast-forward to 2026, and investors are applying what’s now referred to as a "trust filter." They’re scrutinizing tokenomics just as traditional investors dissect cap tables. They want to see utility, realistic vesting schedules, and effective sink mechanisms. Projects with testnets and early traction are far more convincing than those relying solely on a whitepaper. If your conversion rate is falling short despite strong engagement, it’s time to revisit your materials. Are you addressing critical concerns like unit economics, customer concentration, or competitive differentiation? These could be the barriers keeping interested investors from committing.
4. Total Committed Funds
While conversion rates show how many investors are on board, Total Committed Funds reveals the actual capital you’ve secured. This figure – whether in dollars or cryptocurrency – tells you if your campaign has the financial backing it needs to move forward. It’s the bedrock for executing your project’s roadmap.
"The total funds raised is the most basic yet powerful metric. It indicates the ICO’s overall success and provides a financial foundation for the project." – TokenMinds Team
To account for market volatility, report this metric in both native tokens and their USD equivalents. Additionally, use probability-weighted forecasting to predict future commitments. For example, multiply each potential investment by its likelihood of closing – 70% for leads in due diligence, 30% for initial contacts – and aim for a forecasted pipeline that’s twice your funding target. This approach not only provides a snapshot of current funds but also gives a clearer picture of what’s ahead.
A strong Total Committed Funds figure signals high market demand and reduces perceived risk for future investors. Startups that closely monitor financial metrics like this have seen an 18% compound growth rate. Using a CRM can help you track "Expected Commitment" against "Actual Investment Amount", ensuring consistent data while benchmarking against internal goals and burn rates. Transparent reporting of these numbers in investor communications builds trust and demonstrates long-term viability.
"Financial metrics help founders make better decisions and help investors quickly judge stability, efficiency, and readiness to scale. They also add credibility to outreach because strong numbers reduce perceived risk." – Sagar Agrawal, Founder, Qubit Capital
Without precise tracking, Total Committed Funds can feel like a vague concept. But when measured accurately, it transforms engagement into tangible financial results, proving the effectiveness of your outreach efforts.
sbb-itb-7e716c2
5. Investor Retention and Referral Rate
Investor retention and referral rate play a key role in ensuring long-term success for your campaign. These metrics are what separate one-off campaigns from those that evolve into consistent growth engines. Retention measures how many investors return for future funding rounds, while the referral rate tracks how many new participants join through recommendations. Together, they reveal whether your launchpad is cultivating a loyal and self-sustaining community.
In 2025, approximately 74% of revenue came from existing customers. This highlights why focusing on retention tends to deliver better returns compared to costly efforts to acquire new investors. A viral coefficient above 1.0 – where each investor brings in more than one new participant – signals the potential for exponential growth.
"Retention-focused initiatives often yield higher ROI compared to acquisition efforts, as retaining existing customers is generally more cost-effective than acquiring new ones." – Qubit Capital
To calculate your viral coefficient, track how many new investors each participant introduces. Combine this with monitoring churn rates and conducting Net Promoter Score surveys to measure satisfaction and likelihood of referral. Segmenting your investors based on how often they participate can also help identify "power users" who amplify your reach even further.
Keep investors engaged by sharing regular updates on milestones, progress, and financial performance. This consistent communication fosters trust and strengthens the commitment needed for long-term success.
KPI Performance Comparison
Looking at baseline versus optimized performance helps set clear and achievable goals for launchpad outreach. The gap between average results and well-planned strategies can be dramatic, often deciding whether your fundraising efforts succeed or stall.
| Metric | Baseline Performance | Optimized Campaign | Improvement |
|---|---|---|---|
| Net Revenue Retention | 102% | 110% | +8 percentage points |
| Sales Cycle Length | 75 days | 60 days | 20% reduction |
| LTV/CAC Ratio | 3:1 | 5:1 | 66% efficiency gain |
| Revenue Capture | Standard handoffs | Systematic handoff architecture | 15-25% recovery |
These numbers aren’t just theoretical – they deliver real-world impact. For example, Swiipr Technologies successfully closed a $7.6 million funding round in 2025 by leveraging performance tracking and optimized outreach strategies. Startups that actively track their performance tend to outperform, with an 18% compound average growth rate, compared to those that operate without data-driven insights. This demonstrates how systematic tracking can improve both financial outcomes and operational efficiency.
Switching from manual tracking methods to AI-powered centralized systems takes this to the next level. These systems eliminate much of the guesswork that leads to 84% of sales representatives falling short of their quotas. By pinpointing the most effective messaging and identifying where conversions drop off, these tools turn outreach data into a clear, actionable plan for success.
Conclusion
Tracking these five KPIs turns launchpad investor outreach into a precise, data-driven process that delivers measurable outcomes. Without clear metrics, founders risk sending out ineffective messages and confusing activity with actual progress.
These metrics are the bridge between investor interest and financial commitment. Startups that actively track their performance metrics see an 18% compound average growth rate, while 84% of sales representatives without tracking systems fall short of their quotas. By analyzing these insights, you can identify where potential investors drop off in your funnel and fix those weak points before losing valuable commitments.
BeyondOTC simplifies this process by consolidating outreach data and connecting you with established launchpad networks, eliminating the hassle of manual tracking.
The impact of this approach is undeniable. For example, in 2025, Swiipr Technologies raised $7.6 million using performance tracking and refined outreach strategies. Similarly, projects like Ap Tack and Ivent Pro secured funding by relying on a metrics-driven approach.
FAQs
What defines an ‘engaged’ investor in my funnel?
An engaged investor is someone who actively participates in your project in meaningful and measurable ways. This could involve actions like making wallet transactions, attending meetings, or showing genuine interest through consistent involvement. Unlike vanity metrics – such as social media follower counts or the number of people joining a group – these actions showcase real dedication and commitment to your project.
How can I track commitments when investors pledge in both USD and tokens?
To maintain accurate records, log each pledge in its original currency and convert token amounts to USD based on the exchange rate at the time the pledge is made. Keep a detailed ledger that includes:
- The pledged token amount
- Its USD equivalent at the time of the pledge
- Any updated USD value, if applicable
This approach ensures precise tracking of total commitments and makes it easier to report fundraising progress.
What is a good retention and referral benchmark for a launchpad campaign?
High retention rates and strong referral performance often signal the success of launchpad campaigns, though specific benchmarks can differ based on industry and objectives. These metrics highlight how well the campaign resonates with and satisfies investors, showcasing its ability to maintain engagement and trust.